

How to Create a Gantt Chart in WordPress for Project Management
Managing projects can be challenging, especially when you need to keep track of many tasks, deadlines, and team members. A Gantt chart is a useful tool that helps you see your project timeline clearly. It shows all tasks, their start and end dates, and how they overlap.
This makes it easier to plan work and meet deadlines. If you use WordPress for your business or various other activities, you might want to manage projects directly from there. But by default, you can't do this on WordPress. You need an additional plugin for that.
WP Project Manager is such a plugin that you can use in this regard. In this blog post, we'll cover a detailed guide on how to create a Gantt Chart in WordPress for your project management. Hope you'll find this post very helpful. Let's begin.
What Is a Gantt Chart?
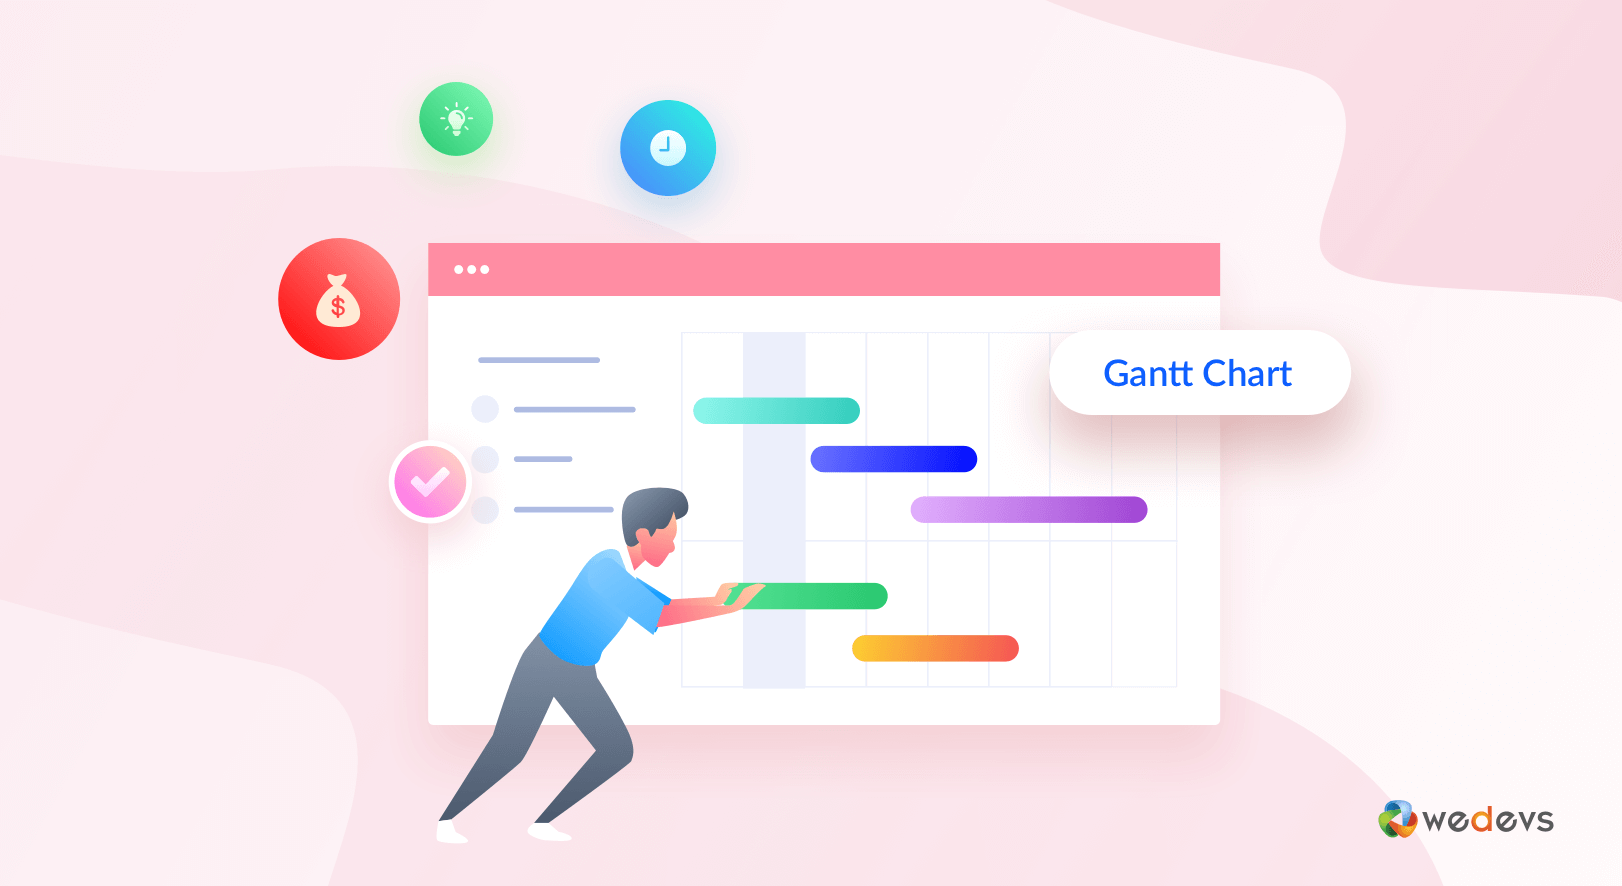
A Gantt chart is a type of bar chart that shows a project’s schedule. It displays tasks or activities as horizontal bars and time along the top. Each bar stretches across a timeline, showcasing the start and end time. This way, you can see which tasks happen at the same time and how long each one takes.
Gantt charts help teams and managers understand the progress of a project at a glance. They make it easy to track deadlines, plan resources, and adjust work if needed. By using a Gantt chart, everyone involved can stay organized and know what to do next to keep the project moving forward.
What Is the WP Project Manager Plugin?
WP Project Manager is a complete project and task management plugin for WordPress. It helps you plan, organize, and track your work directly from your WordPress dashboard. With its simple and user-friendly interface, you can create tasks, assign them to team members, set deadlines, and track progress in just a few clicks with the WP Project Manager plugin.
It also offers tools like to-do lists, milestones, file sharing, and real-time notifications to keep everyone on the same page. Among them, the Gantt Chart is a special tool by which you can track timelines. It also supports a Kanban Board, invoicing, interactive calendars, Slack integration, WooCommerce automation, and more.
How to Create a Gantt Chart in WordPress with WP Project Manager
Creating Gantt Charts on WordPress with precise accuracy becomes absolutely easy once you have the right tools at hand. WP Project Manager is such a plugin. It has a free and premium version.
The premium version has three pricing packages – Personal, Professional, and Business. The Gantt Chart is available in Professional and Business packages. So, if you want to create Gantt Charts with the plugin, you must have the Professional or Business plan installed on your site.
Get the premium versions of the plugin by clicking the button attached below.
Once you have the respective premium version of the plugin on your site, follow the step-by-step guide explained below. Here's a guide on how to install the WP Project Manager Pro and activate the license.
Step 01: Enable the Gantt Chart Module
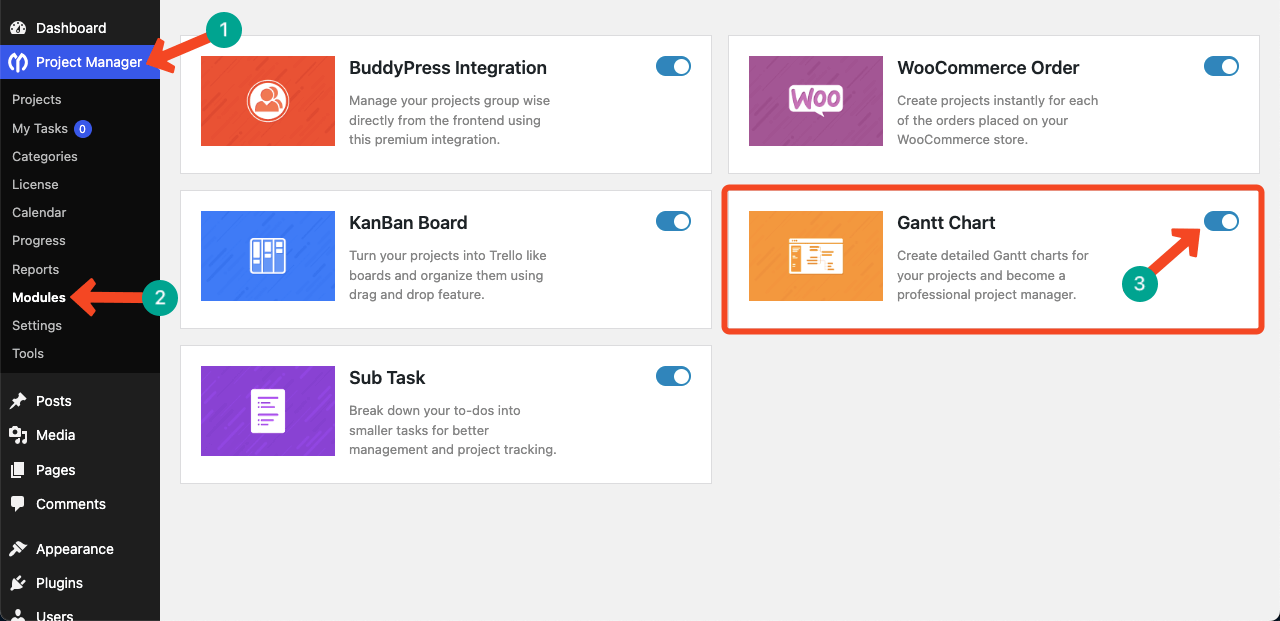
After the plugin is installed, you'll see the Project Manager option appearing on the admin menu bar. Navigate to Project Manager > Modules.
You'll see lots of modules there. Find the Gantt Chart module and toggle it on.
Step 02: Create a New Project
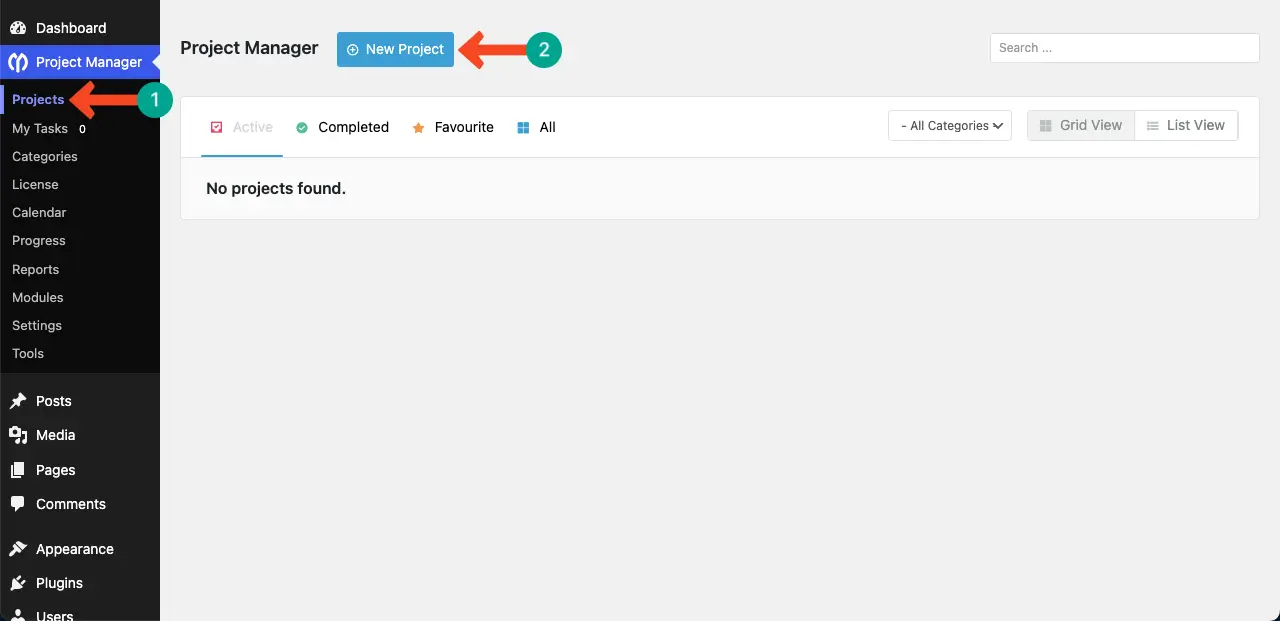
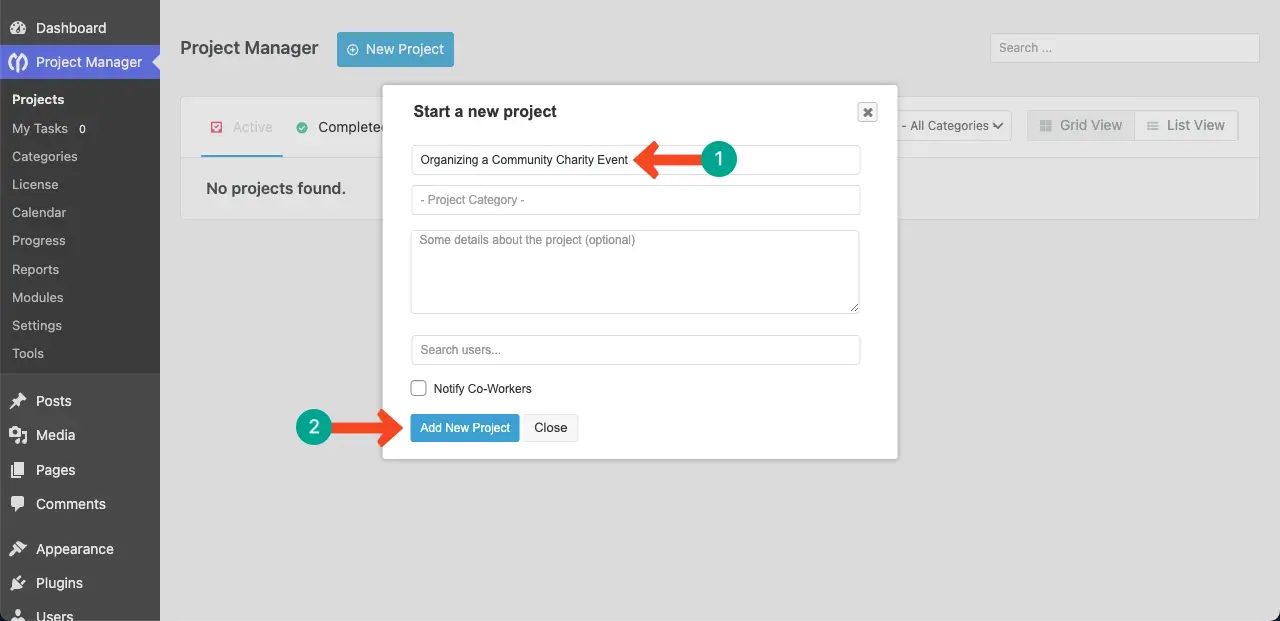
After the module is enabled, come to the Projects option. Then, click the New Project button.
A popup will appear. Write a name for the project. For this tutorial, we are giving it the name ‘Organizing a Community Charity Event.'
Once done, hit the Add New Project button.
Step 03: Add Tasks to the Project
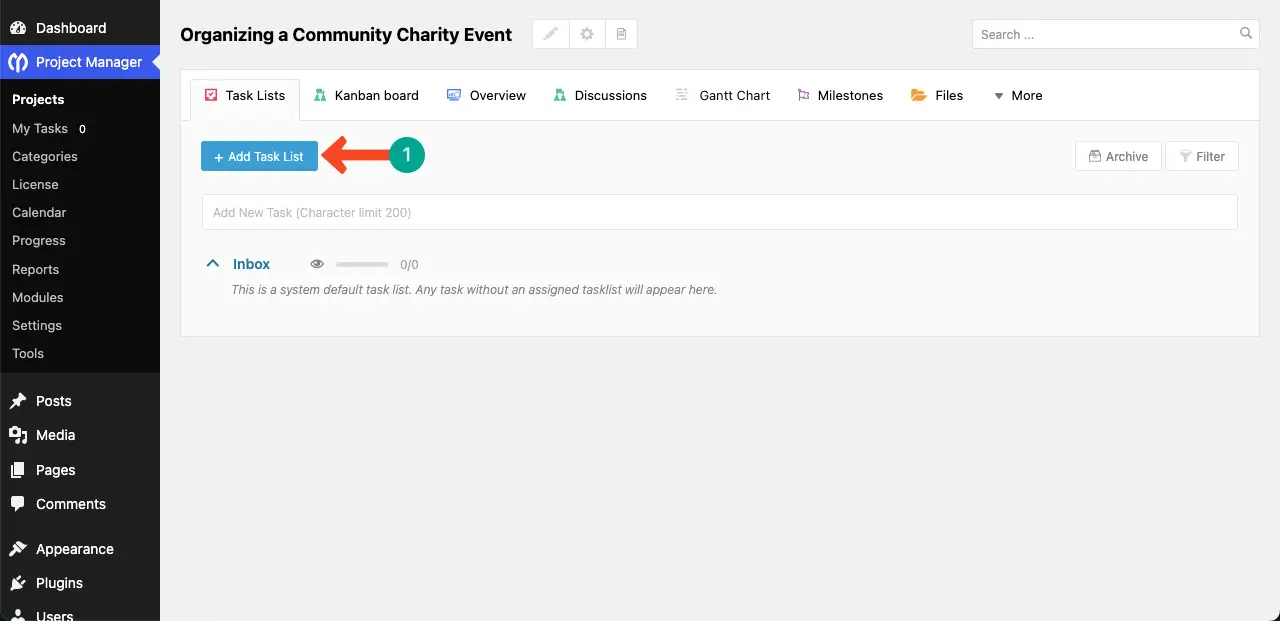
A project is a collection of numerous tasks. And you, of course, know that, in the Gantt Chart, we usually display the tasks in horizontal bars along with a time for each.
Click the Add Task List button.
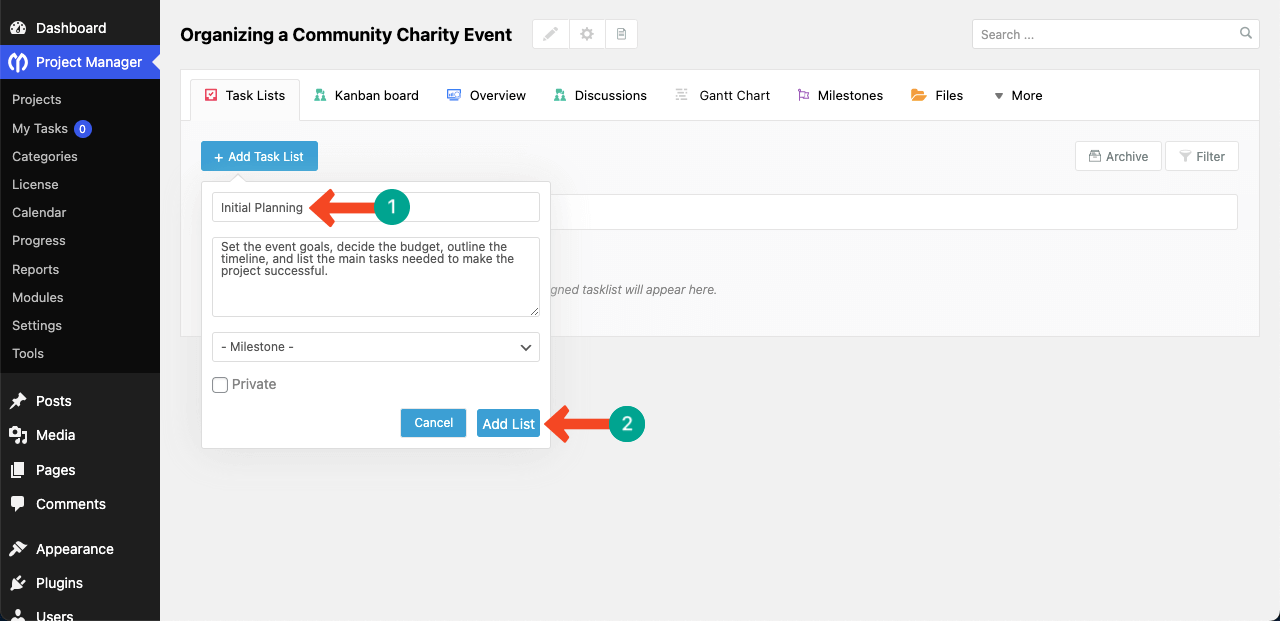
A popup will open up. Write a name for the task list. Then, add a short description (optional). Click the Add List button.
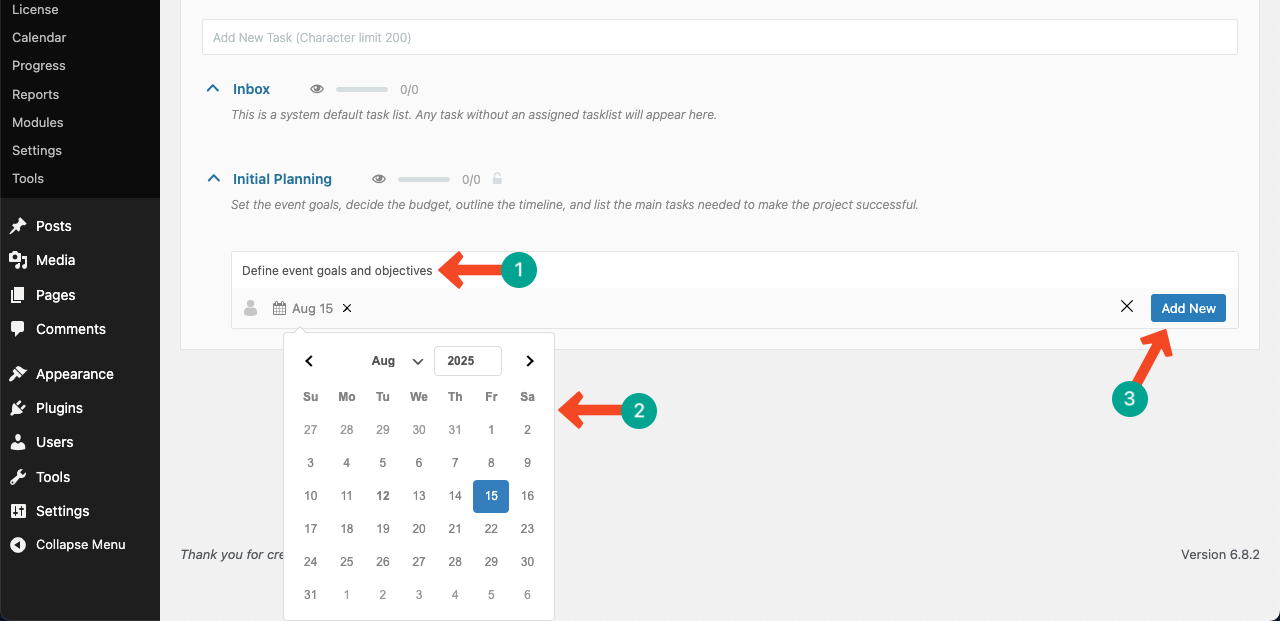
Under the name of the task list, you'll see a box where you can add as many tasks as you want, one by one. Place your cursor in the box.
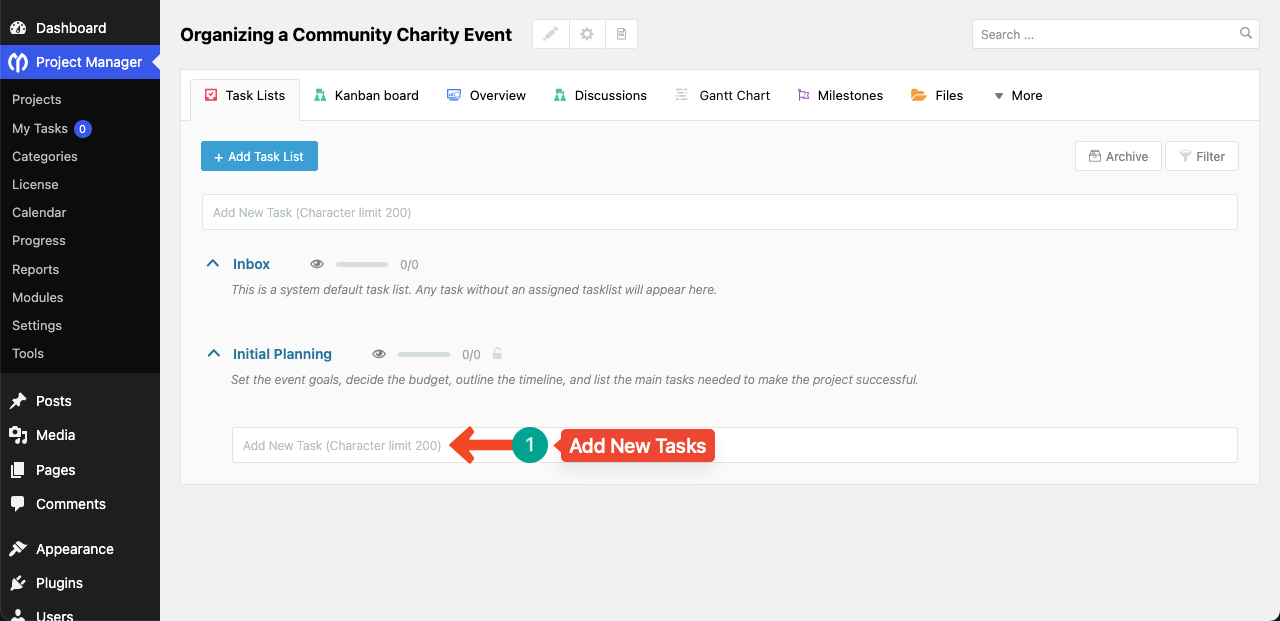
Write a name for the task and set a deadline. Then, click the Add New button.
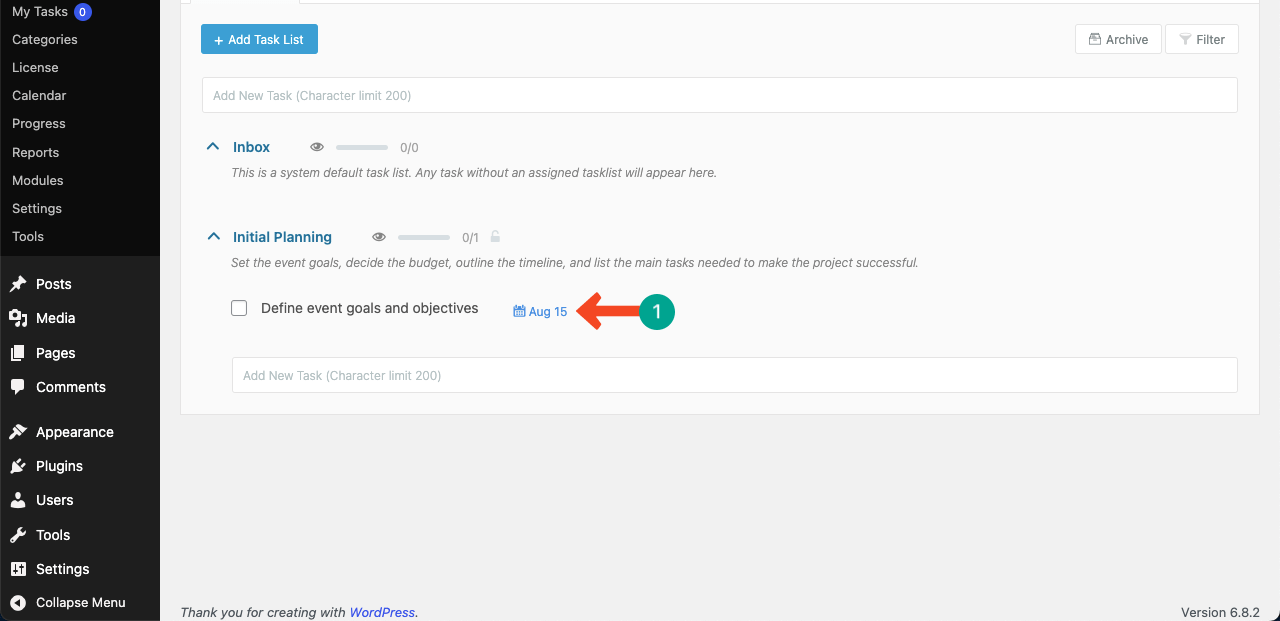
You'll see that a new task has been added to the task list.
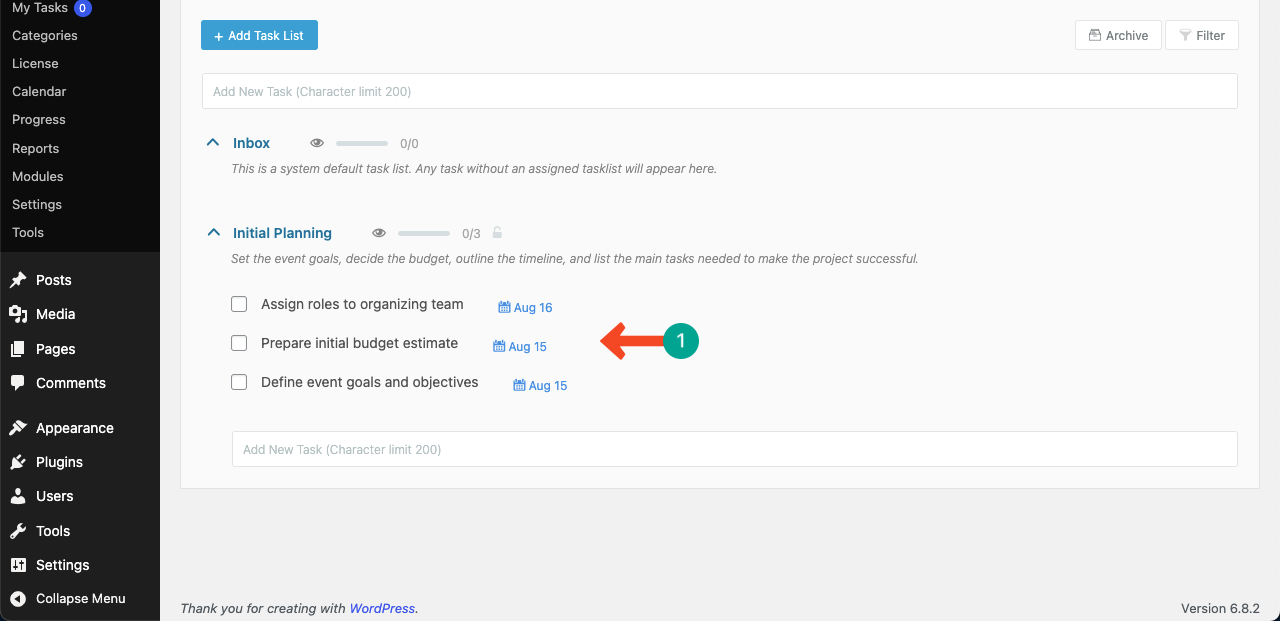
In the same way, add as many tasks as you want to the task list, while specifying a date for each task.
Note: Without adding a date for each task, you can't show them perfectly on the Gantt Chart.
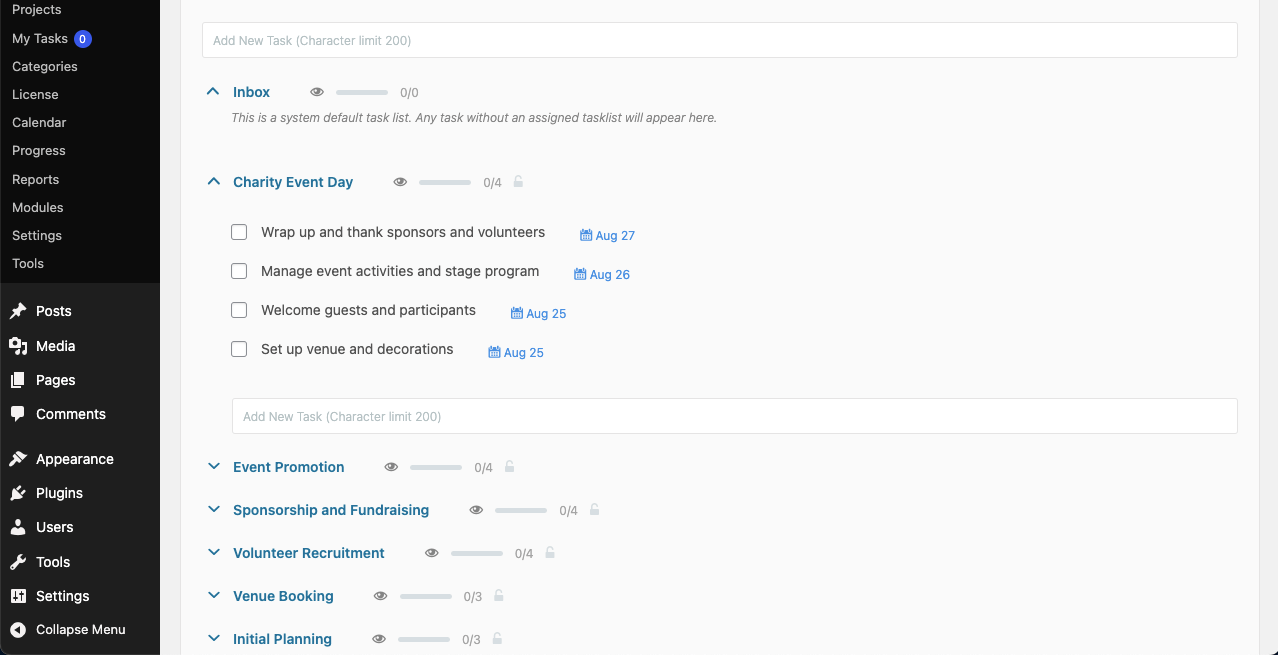
Step 04: Add More Task Lists and Tasks for the Project
In the same way, create as many task lists as you need. Then, add sub-tasks to the lists as required.
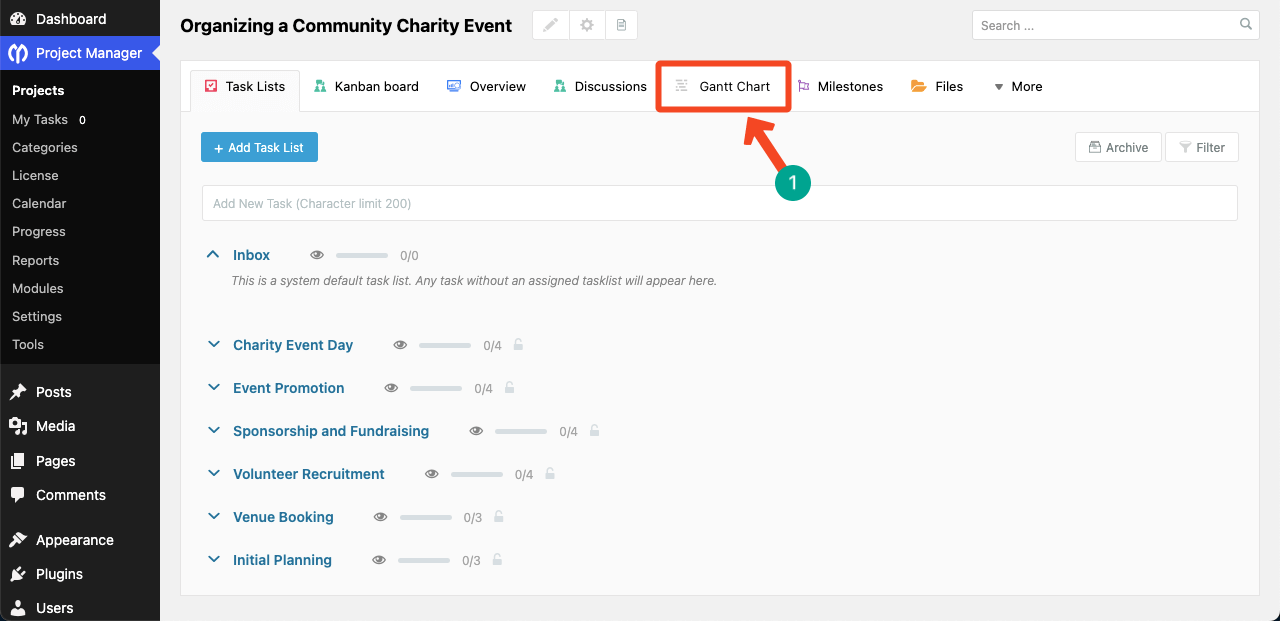
Step 05: Open the Gantt Chart
Click the Gantt Chart option to visit the tab.
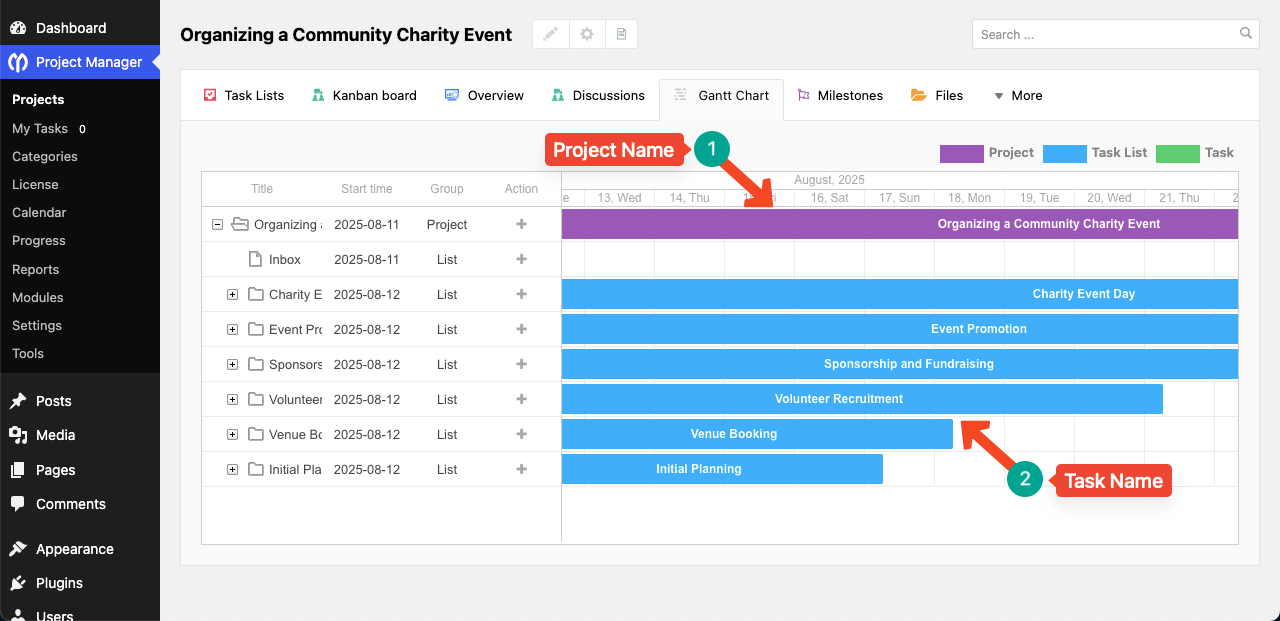
Once you come the Gantt Chart tab, you'll see the tasks are displayed in horizontal bars.
On top, the purple colored bar is the project name. The blue colored bars represent the task list names.
On the left side next to the folder icon, you'll see a plus (+) sign. By clicking the plus (+) icon, you can expand the task list. Once the task list is expanded, you'll see green bars that represent the sub-tasks you added to the respective task list.
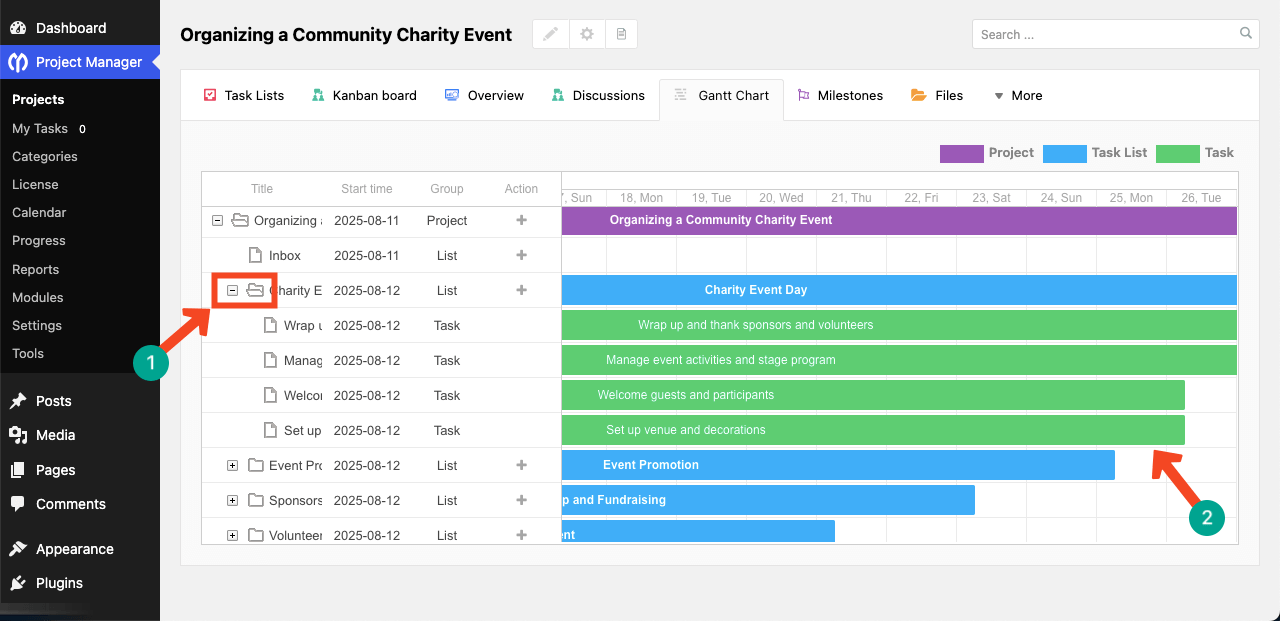
The short video clip attached below shows how to expand and see the sub-tasks.
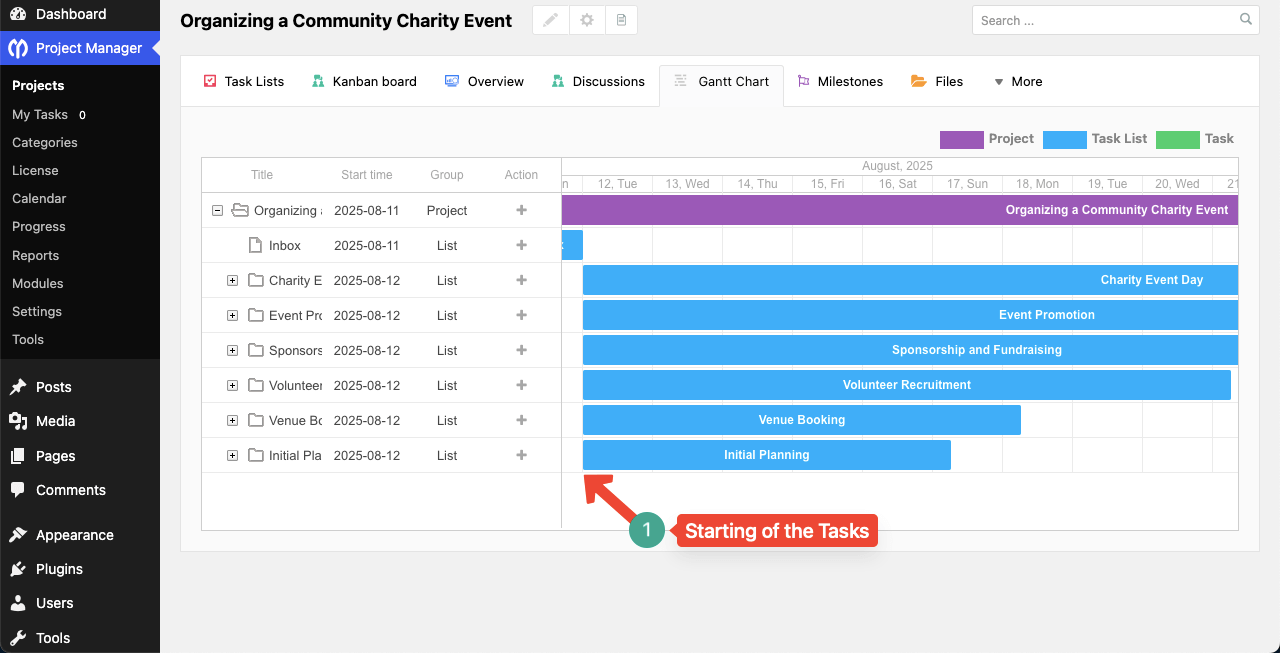
Step 06: Adjust Timeline for the Gantt Chart
Although the Gantt chart shows the deadline for each task, the starting date for all tasks is by default the same as the project’s start date as you can see in the image below.
However, one of the key features of a Gantt chart is that you can set different start and end dates for each task. This way, you can instantly see which task begins after another and when each one needs to be completed. WP Project Manager also lets you adjust the timeline of each task by dragging.
To do this, first expand the task link. Then, select a task by clicking on it.
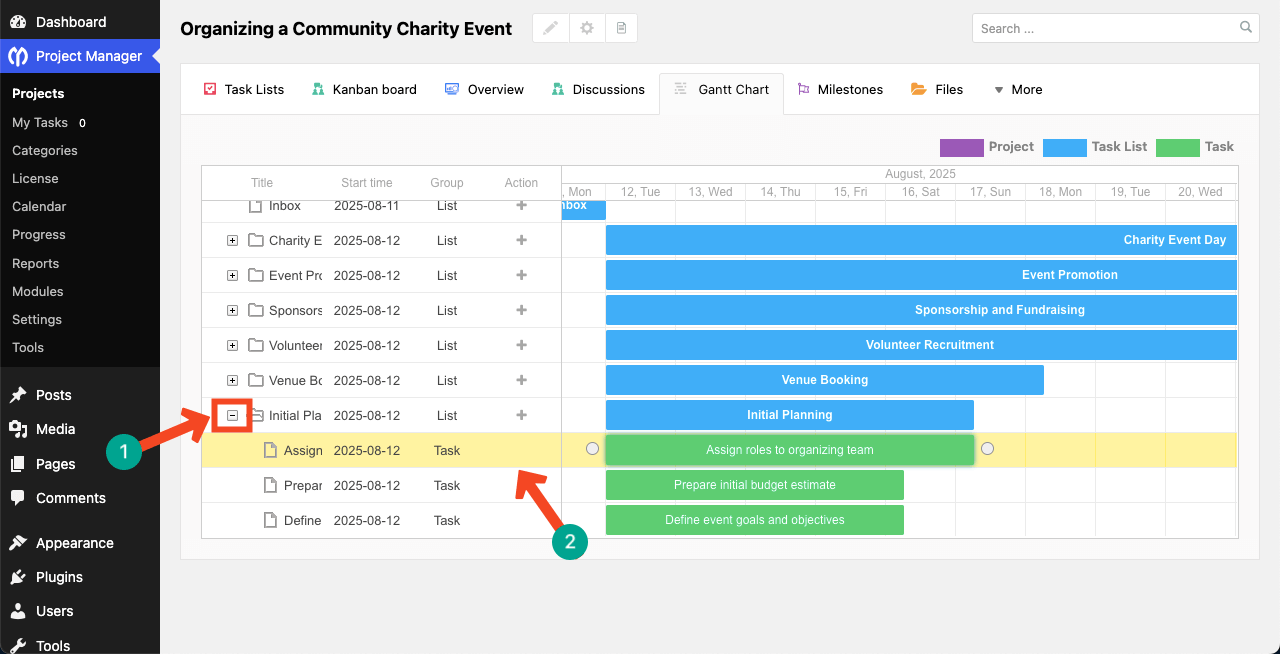
Hover your cursor in between the circle icon and the green-colored task bar. This will show up a small arrow icon. The, by dragging the bar, you can adjust the timeline of the respective task.
The process has been explained in the video clip attached below. In the way, keep adjusting the timeline for all the tasks you want, one by one.
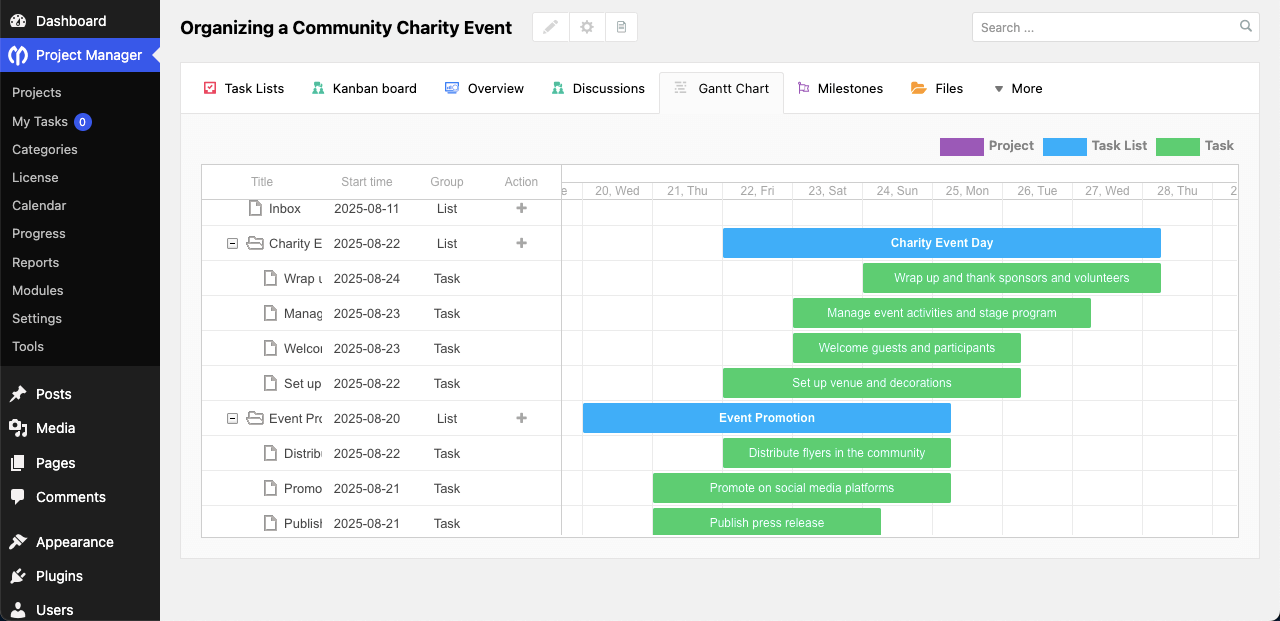
Step 07: Timeline Adjusted for Tasks on the Gantt Chart
You can see that we have already adjusted the timeline for all tasks on the Gantt Chart, following the same process as shown above. Hope you also will be able to do that.
Thus, you can create Gantt Charts on WordPress for managing your projects suitably.
Bonus Point: What Else Can You Do with WP Project Manager
WP Project Manager is more than just a tool for creating Gantt charts. It comes with a variety of features that make project planning, team collaboration, and task tracking much easier inside WordPress. Here’s a quick look at some of the other powerful things you can do with this plugin.
a. Time Tracker
The Time Tracker lets you monitor exactly how long a task takes. You can start, pause, and stop the timer directly from the task interface. This helps you measure work hours for billing purposes or to improve time management in future projects.
b. Kanban Board
The Kanban board allows you to organize tasks into columns like “To Do,” “In Progress,” and “Done.” You can move tasks between columns with drag-and-drop, making workflow tracking simple and visual. It’s great for teams that want to manage progress at a glance.
c. Interactive Task Calendar
With the interactive calendar, you can view tasks by day, week, or month. You can assign tasks, adjust deadlines, and track progress directly from the calendar view. This helps keep your schedule organized and up to date.

d. Control Team Capacities & Member Roles
You can set specific roles and permissions for each team member. This way, managers, clients, and co-workers only see what they need to see. It helps maintain a secure and organized workspace. Learn how to master time management with WP Project Manager.
e. Recurring Task
The recurring task feature lets you set tasks that repeat daily, weekly, monthly, or at a custom interval. This saves time when managing ongoing work, such as monthly reports or weekly meetings.
f. Files & Documents Manager
You can store, organize, and share files directly inside the project. All related documents stay in one place, making it easy for team members to find and use them without searching through emails.
g. Advanced Reports with Insights
With advanced reporting, you can see detailed statistics on task completion, user activity, and overall progress. These reports help managers make better decisions and keep projects on track.
Ending Notes!
Creating a Gantt chart in WordPress with WP Project Manager is a simple yet powerful way to plan and track your projects. By setting clear start and end dates for each task, you can visualize your project flow and avoid confusion. This makes it easier to keep your team aligned and focused.
But when building your Gantt chart, make sure the dates are realistic. Avoid overloading team members with too many overlapping tasks. Always update the chart whenever deadlines shift or new work is added. Keeping the chart accurate will ensure it remains a reliable guide throughout the project.
It’s also a good practice to break large tasks into smaller, manageable ones. This makes progress easier to track and helps identify delays early. Review the chart regularly with your team to discuss updates, address challenges, and adjust plans.
By following these simple habits, you can get the most out of your Gantt chart and keep your projects running smoothly from start to finish. Now, if you still have any questions in your mind, mention them in the comment box below.